Engineering clarity:
We don't just show data, we design understanding
Insight, visualized
In a world overwhelmed by data, clarity is power
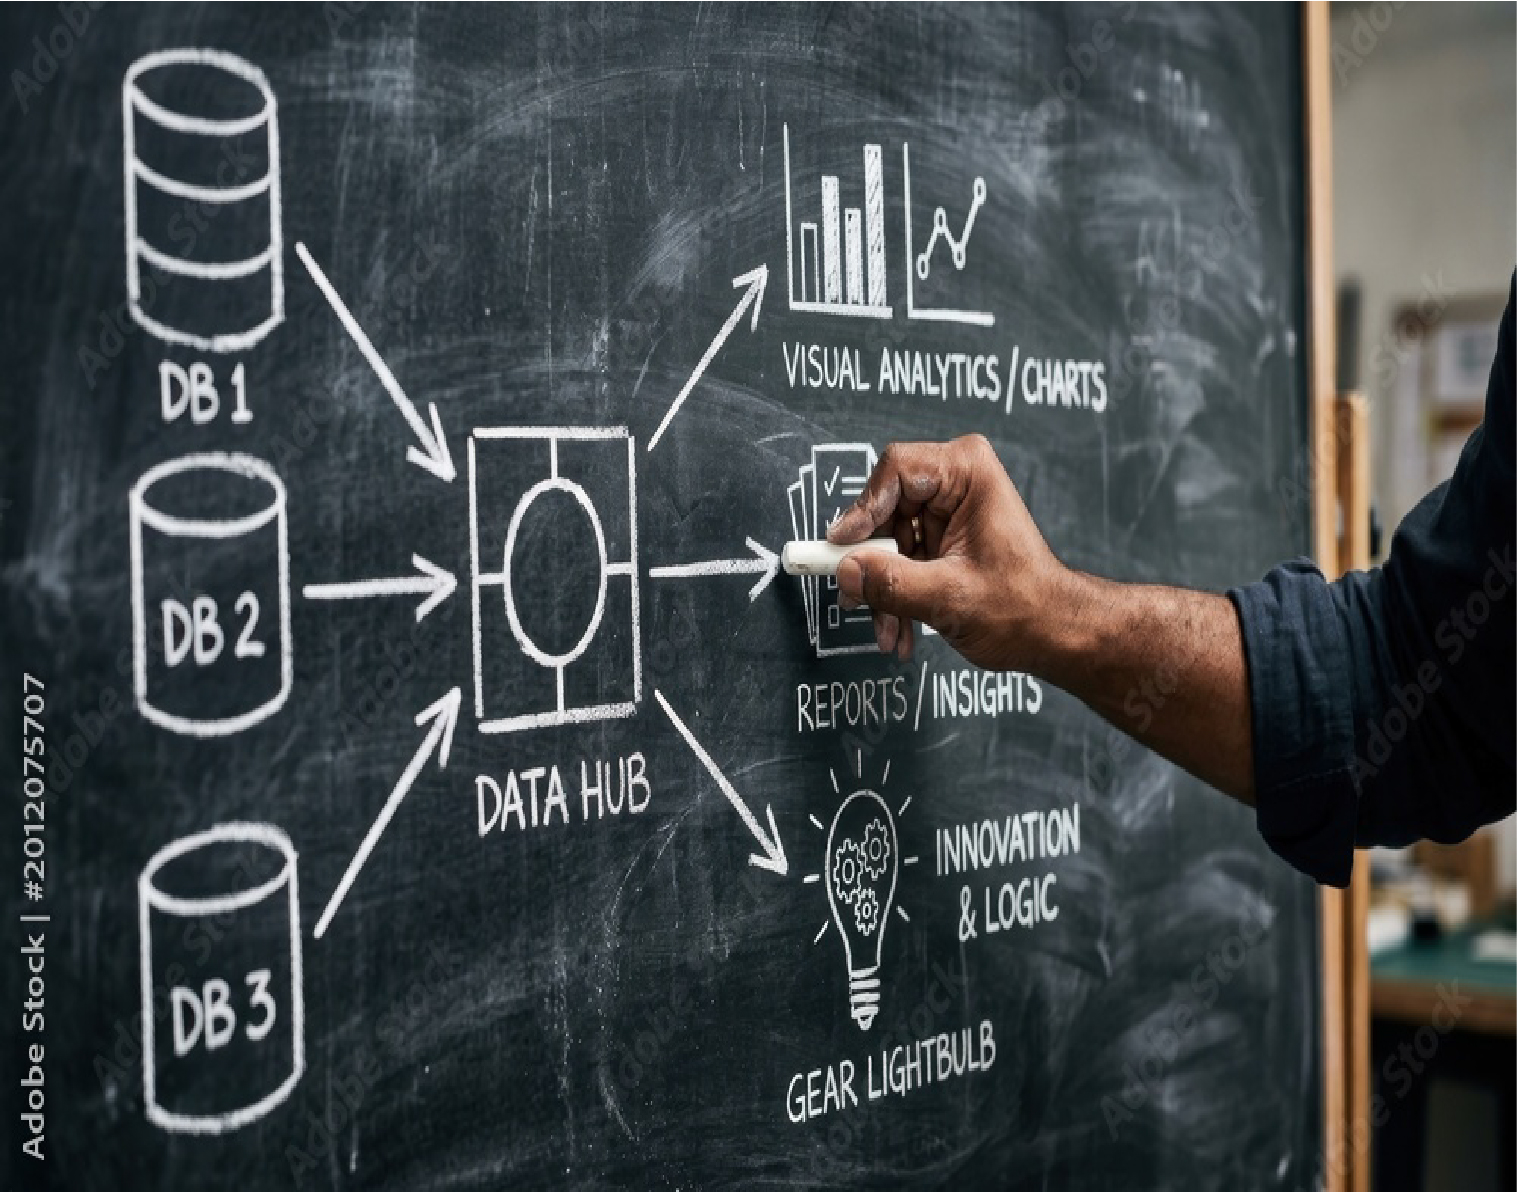
We turn raw data into visual clarity. By designing dashboards and reports that highlight key patterns and trends, we help organizations cut through the noise and make confident, data-driven decisions. Our visualizations translate complexity into business intelligence.
Our Data Visualization Capabilities

We turn analytics into strategic command centers. By combining design thinking, visualization, and AI‑driven automation, our dashboards deliver clarity at a glance, align with business objectives, and empower faster, smarter decisions across the organization.

We design data experiences that are intuitive, engaging, and human‑centered. By applying design thinking principles to dashboards, reports, and interactive visuals, our Design Thinking & Usability service ensures insights are not only clear but also easy to adopt, empowering stakeholders to act with confidence.

We turn static reports into dynamic, interactive experiences. By combining intuitive design, AI‑powered features, and seamless integration, our Interactive Reporting services ensure insights are not only delivered but actively explored. Stakeholders gain the ability to drill down, filter, and personalize views, making data more accessible, engaging, and actionable across the organization.

We design visuals that speak directly to their audience. By tailoring dashboards, reports, and narratives to executives, analysts, and frontline teams, our Audience‑Tailored Design service ensures insights are relevant, clear, and actionable for every stakeholder.

We elevate analytics with sophisticated visualization methods that reveal patterns, relationships, and flows hidden in traditional charts. By applying advanced techniques such as geospatial mapping, network analysis, and time‑series visualization, we ensure your data tells a deeper story — empowering smarter decisions and uncovering insights that standard dashboards often miss.
Our Data Visualization Approach
Effective data visualization turns complex information into clear, actionable insights that support faster decision-making and enhance business performance. This method integrates business context, reliable data, user-centered design, and visualization best practices to create intuitive dashboards and reports. By prioritizing clarity, usability, and measurable results, organizations can increase insight adoption, boost stakeholder engagement, and build a stronger data-driven culture.